
You’ve probably seen it — charts going white, posts announcing that Earth’s heartbeat has spiked to 40 Hz, and the suggestion that this explains the strange energy, the mood swings, the sleep.
I’ve been watching this data for years and I want to give you the honest answer, because the honest answer is more useful than the hype and it holds up when someone challenges you on it.
New here? Start with The Reality Shift Template — my free 3-step framework for filtering the noise and creating on purpose.
What the Schumann resonance actually is
In 1952 the German physicist Winfried Otto Schumann predicted it mathematically, and it was confirmed by measurement later that decade.
Lightning strikes this planet roughly fifty times every second. The electromagnetic energy from all that activity gets trapped in the cavity between the earth’s surface and the conductive ionosphere, which acts as a waveguide — and a standing wave forms inside it.
That standing wave sits at roughly 7.83 Hz. Extremely low frequency. Some people call it the planet’s heartbeat, and I don’t think that’s a bad name for it.
So is it increasing?
Short answer: no, and I got this wrong for years.
The fundamental has sat around 7.83 Hz since it was first measured in the 1960s. It drifts a little between day and night — roughly 7.8 to 8.0 — and that’s it. It has not climbed.
Here’s where the confusion comes from, and it’s an easy mistake to make.
Reading the chart properly
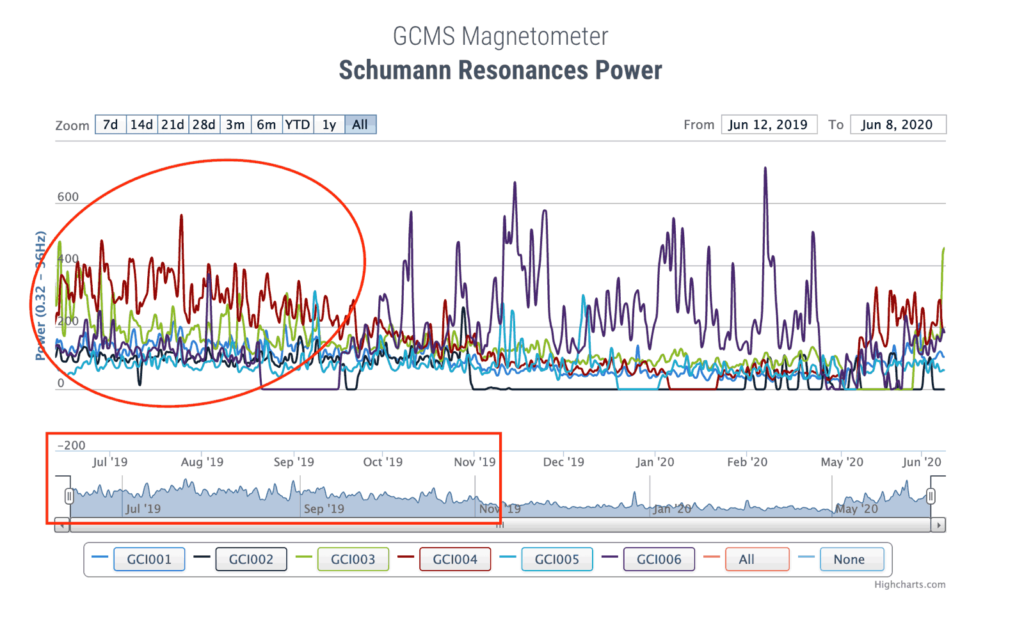
The spectrogram everyone shares comes from the Tomsk station in Russia. Time runs along one axis, frequency along the other — and colour shows amplitude, meaning how strong the signal is, not how fast it’s oscillating.
When global lightning activity surges, power jumps across the entire band at once. That paints the dramatic white columns, sometimes right to the top of the chart near 40 Hz.
It’s a loud day. Not a higher note.
The other half of it: there’s genuine signal at 14.3, 20.8, 27.3 and 33.8 Hz. Those are harmonics — overtones of the fundamental, exactly like the overtones of a plucked string. They were present in the very first measurements sixty years ago. Nothing new appeared.
Someone sees a spectrogram for the first time, notices energy sitting at 33.8 Hz, remembers hearing that Earth resonates at 7.83, and reasonably concludes the frequency has quadrupled. It hasn’t. They’re looking at the overtones and the volume.
Why I’m correcting my own article
I originally wrote that the baseline started climbing in 2014 and was spiking to 15–25 Hz. That was me misreading harmonics as movement in the fundamental.
I’m leaving that admission in rather than quietly editing it out, because it’s the whole point of what I teach. If you want to see clearly, you have to be willing to be wrong out loud.
And I’d already half-suspected it. The earlier version of this article said I wasn’t going to brutally claim the frequency was rising, and warned against becoming a mindfulness-unicorn who loses touch with the ground. That instinct was right. I just didn’t have the mechanism yet.
Why it’s still worth watching
Now, don’t throw the whole thing out. This is where I part company with the debunkers.
The amplitude changes are completely real. The planet genuinely has loud days and quiet days, and that variation is measured, published and free to look at. What’s disputed isn’t whether the electromagnetic environment fluctuates — it’s whether you can feel it.
Science hasn’t answered that. It has mostly not asked. “We haven’t measured it” and “it isn’t there” are not the same sentence, and people in white coats collapse those two more often than they’d like to admit.
So run it yourself. Keep a one-line daily note of energy, mood and sleep. Check the amplitude readings alongside it. Add the moon phase, add solar activity. Give it three months, then look back at your own data.
You’ll either find a pattern or you won’t — and you’ll have something nobody can argue you out of, because you gathered it.
The bigger point
I pay attention to this because it’s one of the few places where something the ancients described and something we can put an instrument on sit next to each other.
Indigenous cultures have talked about the earth having a pulse for thousands of years, without a single measuring device. Then a physicist works out the mathematics in 1952 and finds a standing wave in exactly that place.
That’s worth sitting with. It doesn’t prove the spiritual reading — but it should make you slower to dismiss knowledge that arrived by a route you don’t recognise.
A shift is happening on this planet. I don’t need the Schumann chart to tell me that, and I’d rather not stake the argument on a number that doesn’t say what people think it says. There’s one thing that actually elevates a species, and it isn’t a frequency reading:
Spiritual awareness. That’s it. That’s the whole mechanism.
A more aware species makes entirely different choices about the planet it lives on. We’re getting there.
Watch it yourself
- Tomsk station live measurements — the source of the charts you’ve seen
- HeartMath’s magnetometer data — broader geomagnetic readings
- NOAA Space Weather Prediction Center — solar activity, official and live
More on this: earth energies you can actually monitor covers all three data sources and how to track them together.
Ready to stop drifting and start creating on purpose?
The Reality Shift Template is my free 3-step framework — filter the noise, get clear on who you actually are, and consciously create what comes next. Drop your email and I’ll send it over.